
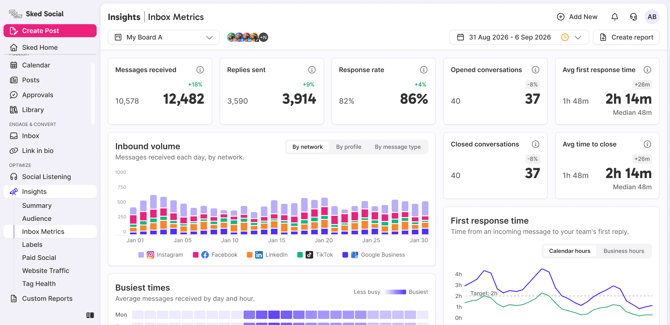
Inbox Metrics shows how many messages came in, how fast your team replied, who did the work, and what is still waiting. Numbers update daily, overnight, and run through yesterday.
Who can use Inbox MetricsInbox Metrics is available on Custom plans. On other plans, you'll see a summary card in its place with details on how to get access. Inbox itself is still on every plan.
Open Inbox Metrics- Go to Insights.
- Select Inbox Metrics.
- Choose a Board.
- Choose a date range.
Every number is compared with the previous period of the same length. If you pick the last 30 days, the comparison is the 30 days before that.
About business hoursThe two duration charts can switch between calendar hours and business hours. Business hours follow your account timezone. There's nothing to set up, and they can't be changed.
What each number meansThe cards at the top
Messages received. Incoming messages, comments, mentions, tagged posts, and original reviews received in the period. Your own messages, internal or system messages, and reactions are not counted.
Replies sent. Replies created in the period, including replies sent directly on the social platform and imported into the Inbox. Editing a reply doesn't add another.
Response rate. The share of conversation openings that got a reply by the end of the period. Each reopening counts as its own opening. Answering three of 19 openings gives 15.8%, shown as 16%. Sending several replies to one opening still answers one opening.
Opened conversations. The number of opening actions in the period, including reopenings. This counts actions, not unique conversations. A conversation opened, closed, and reopened in the period counts as two openings.
Closed conversations. The number of closing actions in the period, including closes by people and by the system. A conversation closed again after reopening counts again.
Avg first response time. The average time from a conversation's first opening to the first reply, across first replies sent in the period. The card uses calendar hours. A reopening doesn't create another sample. First replies at 10 minutes and 30 minutes give a 20-minute average, however many later replies were sent.
Avg time to close. The average time from opening to closing, across closes in the period. The card uses calendar hours. A reopened conversation starts a new cycle from its new opening. If there are six closes but only three have usable opening records, the average uses those three durations. The Closed conversations count stays at six.
Median. Shown under the two averages. It's the middle duration across the same samples, estimated from duration buckets. For five minutes, 10 minutes, and two hours, the median is about 10 minutes and the average is 45 minutes.
Comparison badges. For counts and rates, the badge shows (current − previous) ÷ previous × 100. For durations, it shows the time difference. Percentage changes cap at ±1000%. A rise from zero shows +1000%, zero in both periods shows 0%, and missing comparison data shows N/A. Response rate rising from 20% to 30% shows +50%, not +10 points. An average that falls from two hours to 90 minutes shows 30 minutes faster.
Inbound volume
Messages received by day, split by network, profile, or message type. Switching the split changes the breakdown, not the total. Days follow your reporting timezone.
Busiest times
The average number of messages received for each day of the week and hour. Sked Social divides messages by the number of matching weekday and hour slots in your date range, including slots with no messages. The heatmap shows an average, not a total. If two Mondays have four and zero messages at 9am, Monday at 9am shows an average of two. The heatmap uses your reporting timezone.
First response time and Time to close charts
For each date, the chart shows the average and the approximate median. Lines connect the dates that have data. Dotted ends extend the nearest value visually, and days with no data are not counted as zero. These charts group by UTC date.
Calendar hours or business hours. Calendar hours count all elapsed time. Business hours count only time inside business hours in your account timezone. The toggle changes the two charts. The cards keep using calendar hours. With 9am to 5pm weekday hours, Friday 4pm to Monday 10am is 66 calendar hours and two business hours.
Team performance
One row per team member. If a member has an AI agent, it appears as a row under its owner.
Replies sent. Replies sent through Sked Social, credited to the person who sent them. Replies sent directly on a social platform count in the Replies sent card, but not in a member's total.
Conversations closed. Closes credited to the member, including closes by their AI agent. The agent row is a breakdown already included in the member total. Eight closes by the member plus two by their agent show 10 for the member and two in the agent row.
Avg first response time. The average first response time for replies that member sent through Sked Social, in calendar hours. It's credited to the person who sent the reply, not to whoever the conversation is assigned to now. It shows unavailable if the member has no measurable replies.
Conversations assigned. The number of assignments to the member during the period. It's not their current workload. If you switch or unassign within 12 hours, the previous person's recent assignment is cancelled. Assigning to the same member again doesn't add another. Assign to Alex, then switch to Sam two hours later, and Sam keeps the assignment while Alex's is cancelled.
Backlog age
Conversations opened in your date range that are still open at the end of it, grouped by age in UTC days: under one day (opened that day), one to three days, four to seven days, and over seven days. Each percentage is that group's share of this backlog. Older conversations that were never reopened in the period aren't included. A reply on its own doesn't remove a conversation from the backlog. For a period ending October 21, a conversation opened on October 21 is under one day, October 20 is one to three days, and October 14 is four to seven days.
Conversations by tag
Each conversation and tag pair counts once per UTC day, on the day the tag is added. Sked Social then adds up the daily counts. If you remove the tag within 12 hours, the recent additions are cancelled. This isn't a count of conversations that currently carry the tag. Adding the same tag twice to a conversation on one day counts once. Adding it on two different days counts twice.
Good to know- Numbers refresh overnight and run through yesterday. Today's messages show up tomorrow. For what needs a reply right now, use the unread and awaiting reply counters in the Inbox.
- Opened and Closed conversations count actions, so a reopened conversation counts twice.
- The summary cards use calendar hours. Only the two duration charts switch to business hours.
- Business hours are set by your account timezone and can't be configured.
- History: [Note: Inbox event capture started on 14 Oct 2026, and earlier look backs are not supported]
- Values on some older conversations may look higher than expected if batches of old conversations are closed
Common questions
Why doesn't Replies sent match the total in Team performance? The card counts every reply, including replies sent directly on the social platform. A member's total only counts replies sent through Sked Social.
Why don't I see today's activity? Inbox Metrics runs through yesterday. Numbers refresh overnight.
Why is my response rate lower than I expected? Response rate counts replies only. Opened conversations that got no reply by the end of the period lower it.
Why do Opened conversations and Closed conversations look high? They count actions, not unique conversations. A conversation that is reopened counts each time.
Can I turn this into a report? Yes, use the Create Report button to generate a PDF of your Inbox Metrics