
Power your marketing with Sked Insights — your all-in-one analytics and reporting dashboard. Track post engagement, follower growth, likes, Stories and Reels performance, review scores, and more across Instagram, Facebook, LinkedIn, and Google Business. What is Sked Insights? Sked Insights is a social media analytics dashboard that consolidates performance data from multiple platforms into one place, helping marketers and agencies measure results, identify trends, and make data-driven decisions.
Why bother with insights anyway?
The great part about social media marketing is that it's measurable in a way that billboards aren't (or at least, billboards are harder!). Every social media manager will always tell you that they want more and more data to drive their decisions.
But then at the same time, it's easy to be overwhelmed with data galore – without a clear answer to the question of "so what does this actually mean"?
This is especially true for marketers or clients who are newer to analytics. We've all had that debate about how followers are a way to measure success but not the only way to measure success. A café with 500,000 followers who all live on the other side of the world doesn't actually … sell more coffee. And that's the point right?!
Ultimately you really need to think about not just what metrics you can get, but making sure that you are tracking the metrics that matter to your business.
Sked Insights strikes a balance between raw data — export the numbers to Excel whenever you need them — and clear, actionable summaries that tell you what to do next. A simple example: our best time to post feature, powered by data on when your followers are most active online.
Below, we'll walk through each section of the Sked Insights dashboard, using Instagram as the primary example. Note that available metrics vary by platform — see the platform-specific sections for LinkedIn and Google Business details.
Accessing insights from your desktop
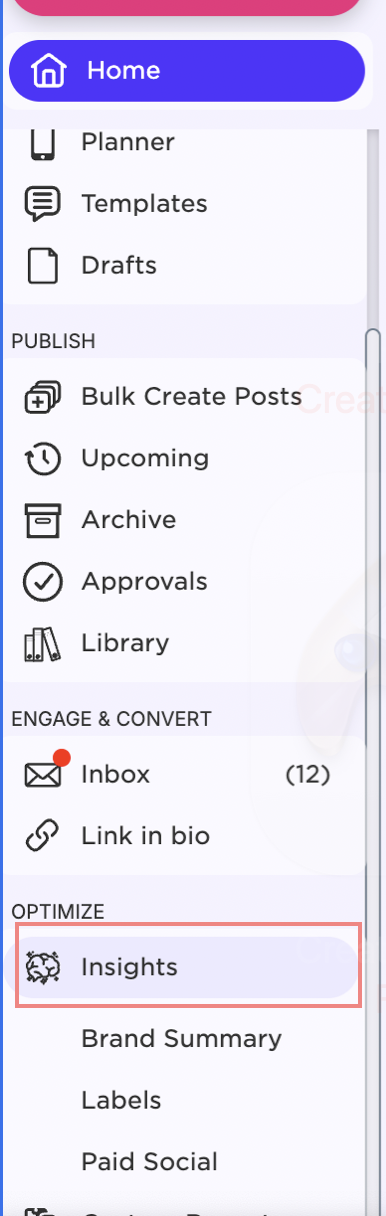
Sked makes it easier to review performance across all of your social channels in one place. To access Insights, head to your Sked dashboard and click 'insights' in the main navigation.
What Sked Insights tells you
There are various categories on your Insights dashboard depending on what platform you are analyzing. Here's a quick overview:
Overview: How are things tracking?
The Overview tab gives you a high-level summary of important analytics. You can select the data you want to see over the past 7 days, 1 month, or 90 days, or select your own date range from the calendar. To get even more from your reports, use the comparison period option to benchmark against any historical time frame — not just the previous period, but also the prior quarter or year — for richer, more meaningful insights.

Questions this section answers:
-
What's the average organic engagement rate for my posts?
-
Are my followers, engagement rate and reach trending up or down?
When you scroll down the page, you’ll see the posts that were posted during the time frame you selected.
You can easily sort these in a number of ways, including by time, interaction, plays, etc. by selecting from the dropdown on the right.
Click on an individual post card to view more details. This will show you the types of interactions, reach and views.

Underneath the individual posts you’ll see average engagement, interactions, likes and comments and how they compare to the previous period.
Questions you should look at in this section include:
-
Which posts performed best in terms of engagement or views?
-
For posts that are outliers performing well or poorly, what is different about them? Look at the creative (image and caption) in particular here to see what might be resonating most!
-
How does engagement impact the algorithm's reach for my posts? – to look at this, review the engagement metrics in the first 24 hours, as the early interactions from followers is one of the main factors in the Instagram and Facebook algorithms
Content: What content resonates with your audience?
This is a further breakdown of your individual posts, engagements over time, engagement types, and views. The aim of this section is to help you work out the kinds of content that resonate best with your audience.
First up is Posts. Similar to the posts on the overview page, here you’ll see all of your Instagram or Facebook posts within the date range with their analytics. Clicking on an individual card brings up more in-depth insights.
Keep scrolling and you'll see Engagements. When you scroll to this section, you’ll see engagement, engagement rate and a chart of engagement over time and engagement types. Engagement types shows you likes, comments and saves by single days.
Hashtag Performance
See which hashtags are working best for you and your growth. This analyses your posts based on the hashtags that you have used in the captions, and shows you a summary of the metrics that you've seen for each hashtag that you've used.
Audience Summary
This page includes important metrics to track your overall growth, reach, demographics, and follower behaviors including best times to post.
Of course, the best time to post can change depending on type of content, relevant events and when you are able to be online and engage with your followers.
You'll notice that the best time to post will be automatically loaded and recommended for you when you set up your Sked queue – this is a great way to easily adjust your post timing as and when the best time to post for your audience changes without having to go in and edit every post manually.

Questions to look at here:
-
If follower change goes up or down – what was the cause? Was it a particularly well-performing post, or an ad campaign?
-
Are these metrics trending up or down over time?
Stories & Reels
Sked Insights provides detailed metrics on your Stories and Reels, including plays, reach, impressions, engagement (likes, comments, shares), and completion rate. Use these metrics to understand what resonates and optimize your short-form video strategy.
And here's the best part - from the day you connect to Sked we'll be storing your story performance, say goodbye to the 24 hour expiration!
Competitor tracking and analysis
On our Launch plan and above, you can also add competitors to track their performance and compare to your account. This feature currently supports Instagram. Check our help center for the latest information on platform availability.
In the competitor section, you can look at:
-
Summary metrics like the change in the number of followers
-
How many posts and what type of posts your competitors are posting
-
When they post their content in the week
-
Average engagement rates, likes and comments on different posts
-
The top 5 posts across all competitors by engagement, likes or comments
You can see an example of the data we share here:

Weekly & monthly insights summary emails
When you have an account connected to Sked, we also send you a weekly and/or monthly summary to your email.

The email contains a summary of:
- Followers, views, reach and posts made, including the % change from the week before
- Total likes and comments and the average engagement rate for posts from that week, including the % change from the week before
- Top 3 performing feed posts that you made the week before
- A summary of your story performance: number posted, views, reach and completion rate including the % change from the week before
- Tip: Many Sked users forward this email directly to clients or internal stakeholders as a quick performance summary.
Export to PDF
Export a polished, presentation-ready PDF report for your brand in just a few clicks. Learn more in our PDF export guide.
Export to Excel
Need the raw data? No problem. Click 'Download Audit Report' to receive your Excel report! This file provides a comprehensive, year-to-date (Jan 1 to today) snapshot of your account data.
You'll get a detailed breakdown of all individual social accounts across every platform we support in a single file. You can read more about this here!
Share as web link
The final way to share your insights is via our 'web link' feature. This generates a time-restricted secret URL that you can share with your clients or colleagues so that they can browse all of the data you can see in your insights dashboard without them needing their own Sked login.
The interface for the person you're sharing with is the same as what you see in Sked, but they won't have access to anything else in your dashboard.
When you create a link, the user will only be able to see the data for the date range you have selected. It's great for sharing summaries at the end of a campaign or month.
Our insights web links work great alongside our other features for working with other external stakeholders like our branded post review portals.
That covers everything in Sked Insights. With all your social media performance data in one organized dashboard, you have everything you need to make smarter decisions and grow your presence across every channel.